RVOL + Volume Z-Score (Textbook)This indicator is a relative-volume and “volume anomaly” dashboard designed to help you quickly spot when a ticker is actually in-play versus simply drifting on normal activity. It plots standard volume bars (colored by up/down candles) and overlays multiple optional smoothers of volume (SMA, LSMA/linear-regression MA, HMA, ALMA) so you can see whether participation is expanding or fading across different smoothing styles. It also calculates RVOL (current bar volume divided by the average volume over a user-defined lookback) and displays RVOL (and Z) in a small table for quick reference.
The core feature is a textbook volume z-score: Z=(V−SMA(V,N))/StDev(V,N)
This measures how far the current bar’s volume is from its recent average in standard-deviation units, making it easy to filter for genuinely unusual volume. The script plots mean + 1σ and mean + 2σ threshold bands and can highlight “anomaly” volume bars when Z exceeds your chosen σ thresholds (default 1σ for broader detection, with alerts available for 1σ/2σ). Use it as a participation filter: combine high RVOL / high Z with your price structure (key levels, VWAP, trend) to validate breakouts or identify high-conviction reversal/flush events.
在腳本中搜尋"key levels"

Multi-TF Candle Gap DetectorHigh timeframe gap detector, these work well to identify key levels to trade from

new alertable spacemanhope these alerts work. open to fixes
slight modification to Key Levels SpacemanBTC IDWM script
credit: spacemanbtc
PST Super Simple System v2.5+PinkSlips Trading was built to give traders real structure, real tools, and real support — without the confusion or false promises you find everywhere else. Everything we provide is focused on helping you trade with clarity and confidence.
Professional-Grade Indicators
We develop custom TradingView indicators designed to simplify your decision-making. Clean, reliable, and built to support consistent trading.
Daily Live Trading Sessions
Members can watch the market with us in real time. We walk through bias, key levels, trade execution, and risk management so you can learn the process step-by-step.
Personal Guidance and Trade Planning
Whether you need help building a strategy, fixing your discipline, or understanding your data, we offer direct support and tailored plans to help you improve faster.
A Focused, Results-Driven Community
PinkSlips Trading is built for traders who want to get better — not for hype. You’ll be surrounded by people who take trading seriously and are committed to long-term growth.

Order Flow AnalysisOrder Flow Pressure Suite — Wick, Volume & Absorption-Based Pressure Map
This indicator builds a composite buying/selling pressure score from candle structure, volume behavior, and absorption signals.
It is designed to infer the “intent” behind price moves by looking at how candles form, where they close, and how volume behaves — even without access to true bid/ask or footprint data.
Core Concepts
Wick-to-Body Analysis
The script evaluates the ratio of upper and lower wicks to the total candle range.
Strong wicks with relatively small bodies are treated as rejections :
Long upper wick → potential selling pressure / rejection of higher prices
Long lower wick → potential buying pressure / rejection of lower prices
Close Position Analysis
The close is normalized within the candle range:
Close near the high → bullish pressure
Close near the low → bearish pressure
Close near the middle → more neutral , context taken from wicks and volume
Volume Delta Estimation
Since true bid/ask data is not available on standard charts, the script estimates “volume delta” by distributing total volume between buyers and sellers based on candle characteristics:
Bull candles receive more “buying volume,” weighted toward closes near the high
Bear candles receive more “selling volume,” weighted toward closes near the low
This is an approximation of order flow, not a direct time & sales feed.
Absorption Detection
The script looks for candles where volume is high but price movement is relatively small .
This combination often suggests:
Bullish absorption → buyers absorbing aggressive selling (potential accumulation)
Bearish absorption → sellers absorbing aggressive buying (potential distribution)
Absorption zones are tracked over a configurable lookback and can be shaded in the background.
Composite Pressure Oscillator
All the above components (wicks, close position, heuristic volume delta, absorption bias) are blended into a single pressure score :
Values > 0 → net buying pressure
Values < 0 → net selling pressure
The raw score is smoothed with an EMA to reduce noise and create a cleaner oscillator line.
Divergence Detection
The indicator compares price pivots to pressure pivots:
Bullish divergence : price makes a lower low while pressure makes a higher low
Bearish divergence : price makes a higher high while pressure makes a lower high
These conditions can help highlight potential exhaustion or hidden participation from larger players.
Visual Elements
Histogram showing the intensity of buying/selling pressure
Color-coding for increasing vs. decreasing pressure
Background shading for detected absorption zones
Status table summarizing current pressure, trend bias, volume delta, wick signal, and absorption state in real time
How To Use
Use the pressure oscillator to gauge whether the current bar sequence is dominated by buyers or sellers. Strong positive readings may indicate sustained buying pressure; strong negatives may indicate sustained selling pressure.
Watch for divergences between price and the pressure oscillator around key levels, swings, or zones you already care about.
Use absorption zones and wick rejection signals as additional context around support/resistance, breakouts, or failed moves.
Treat all signals as context and confluence , not as stand-alone trade entries or exits. This tool is best used alongside your existing price action, volume, and risk management framework.
Important Notes & Limitations
This script does not access real bid/ask, footprint, or order book data . All volume delta and absorption interpretations are heuristic estimates derived from OHLCV candles.
Signals are probabilistic , not guarantees. They can be early, late, or outright wrong in fast or low-liquidity markets.
Always validate signals with your own analysis, timeframe alignment, and risk management. This indicator is intended as an analytical tool , not financial advice.

SuperMegaIndicator5000SuperMegaIndicator5000
key levels
ema
volume on price High Vol LowV and chop on price
London open close
vwap
orb
and maybe a couple other indicators

XAUUSD Pro Setup Suite manuel_lnt.fx is an advanced Pine Script v6 indicator designed exclusively for XAUUSD, built to automatically detect the 5 highest-probability setups in gold day trading.
It combines institutional price action, volatility patterns, mean reversion logic, and momentum confirmation to generate clean, filtered, and actionable signals.
The indicator automatically detects:
⸻
1️⃣ Break & Retest Premium (BR)
Identifies valid breaks of key levels and signals the retest with rejection wick, EMA20 trend confirmation, and neutral RSI.
→ Excellent for trend continuation.
⸻
2️⃣ Fakeout Liquidity Trap (FO)
Detects liquidity grabs above highs or below lows with an opposite close + engulfing candle confirmation.
→ The strongest setup for fast and explosive reversals on gold.
⸻
3️⃣ MACD Zero-Line Shift (MACD)
Signals when the MACD crosses the zero line while price breaks micro-structure.
→ Perfect for spotting the start of a new trend.
⸻
4️⃣ Bollinger Squeeze → Breakout (BB)
Recognizes volatility compression and signals when a breakout is likely to explode.
→ Ideal for clean breakout trades.
⸻
5️⃣ Mean Reversion on EMA50 (MR)
Highlights price extensions far away from the EMA50 with ATR confirmation and a reversal candle.
→ Great for pullbacks back toward the mean value.

ADX + RSI Screener FlagsThis indicator screens for ADX under a certain threshold and RSI under a certain threshold. By default set to 13 and 40, respectively, which are key levels indicating a potential bullish reversal.

Ravio This indicator identifies false breakouts and confirmed breakouts on any timeframe. It automatically analyzes price action around key levels (such as recent highs and lows) to detect when the price temporarily breaks above or below a level but then quickly returns — signaling a false breakout.
When a breakout is confirmed (price holds beyond the level with strong volume or momentum), the indicator highlights it with a different color.
RaviossaThis indicator identifies false breakouts and confirmed breakouts on any timeframe. It automatically analyzes price action around key levels (such as recent highs and lows) to detect when the price temporarily breaks above or below a level but then quickly returns — signaling a false breakout.
When a breakout is confirmed (price holds beyond the level with strong volume or momentum), the indicator highlights it with a different color.
Liquidity Sniper V3 (ANTI-FAKEOUT)An advanced institutional trading indicator combining liquidity pool targeting, smart money concepts, and momentum-based entries with comprehensive risk management.
🎯 CORE FEATURES:
- Liquidity Sniper Module: Identifies and targets major liquidity pools (PDH/PDL, PWH/PWL, Equal Highs/Lows, HVN/LVN edges)
- Anti-Fakeout Stack: 10-layer confirmation system including VWAP reclaim, micro BOS, displacement, relative volume, and mitigation entries
- Momentum Engulf Add-On: Catches high-velocity impulsive moves with engulfing candles, volume spikes, and volatility breakouts
- GARCH Volatility Filter: Dynamic volatility analysis to avoid choppy conditions
- Multi-Timeframe Confirmation: Ensures alignment across timeframes before entries
📊 SIGNAL CLASSIFICATION:
- BEST (Green): Highest probability setups with all confirmations aligned - 6.0+ score
- BETTER (Medium Green): Strong setups with most confirmations - 4.5-6.0 score
- GOOD (Light Green): Valid setups with basic confirmations - 3.0-4.5 score
🔍 TRADE SCENARIOS:
S1: Liquidity Reversal - Sweeps + reversals at key levels with displacement
S2: Continuation - Trend following with VWAP mean reversion
S3: Mean Reversion - Extreme deviations (2σ+) with Fibonacci exhaustion
S4: Deep Sweep - 3σ sweeps at major liquidity with high confluence
⚡ MOMENTUM TRIGGERS:
- MET (Momentum Engulf): Bullish/bearish engulfing with 1.5x+ volume spike and ATR impulse
- VBT (Volatility Breakout): Range breakouts with sigma bursts and participation
🛡️ RISK MANAGEMENT:
- Dynamic TP/SL based on ATR, VWAP bands, and liquidity pools
- 3-tier targets (T1: VWAP, T2: Nearest pool, T3: 5R extension)
- Early invalidation tracking (0.5R movement monitoring)
- Minimum 2:1 RR requirement with cooldown periods
- RTH session filters and anti-spam protection
📈 TECHNICAL EDGE:
- SMT Divergence detection vs ES correlation
- CVD (Cumulative Volume Delta) divergence confirmation
- FVG (Fair Value Gap) and Order Block mitigation entries
- Equal highs/lows clustering analysis
- Volume profile HVN/LVN identification
⚙️ FULLY CUSTOMIZABLE:
All parameters adjustable including cooldowns, proximity thresholds, ATR multipliers, RR floors, and scenario weights.
Perfect for: ES/NQ futures, forex majors, and liquid stocks. Works on 1-15 min timeframes. Best results during NY session (9:35-11:00 AM & 1:30-3:30 PM ET).
Created for serious traders seeking institutional-grade edge with quantifiable risk/reward and high-probability setups

Adaptive Vol Gauge [ParadoxAlgo]This is an overlay tool that measures and shows market ups and downs (volatility) based on daily high and low prices. It adjusts automatically to recent price changes and highlights calm or wild market periods. It colors the chart background and bars in shades of blue to cyan, with optional small labels for changes in market mood. Use it for info only—combine with your own analysis and risk controls. It's not a buy/sell signal or promise of results.Key FeaturesSmart Volatility Measure: Tracks price swings with a flexible time window that reacts to market speed.
Market Mood Detection: Spots high-energy (wild) or low-energy (calm) phases to help see shifts.
Visual Style: Uses smooth color fades on the background and bars—cyan for calm, deep blue for wild—to blend nicely on your chart.
Custom Options: Change settings like time periods, sensitivity, colors, and labels.
Chart Fit: Sits right on your main price chart without extra lines, keeping things clean.
How It WorksThe tool figures out volatility like this:Adjustment Factor:Looks at recent price ranges compared to longer ones.
Tweaks the time window (between 10-50 bars) based on how fast prices are moving.
Volatility Calc:Adds up logs of high/low ranges over the adjusted window.
Takes the square root for the final value.
Can scale it to yearly terms for easy comparison across chart timeframes.
Mood Check:Compares current volatility to its recent average and spread.
Flags "high" if above your set level, "low" if below.
Neutral in between.
This setup makes it quicker in busy markets and steadier in quiet ones.Settings You Can ChangeAdjust in the tool's menu:Base Time Window (default: 20): Starting point for calculations. Bigger numbers smooth things out but might miss quick changes.
Adjustment Strength (default: 0.5): How much it reacts to price speed. Low = steady; high = quick changes.
Yearly Scaling (default: on): Makes values comparable across short or long charts. Turn off for raw numbers.
Mood Sensitivity (default: 1.0): How strict for calling high/low moods. Low = more shifts; high = only big ones.
Show Labels (default: on): Adds tiny "High Vol" or "Low Vol" tags when moods change. They point up or down from bars.
Background Fade (default: 80): How see-through the color fill is (0 = invisible, 100 = solid).
Bar Fade (default: 50): How much color blends into your candles or bars (0 = none, 100 = full).
How to Read and Use ItColor Shifts:Background and bars fade based on mood strength:Cyan shades mean calm markets (good for steady, back-and-forth trades).
Deep blue shades mean wild markets (watch for big moves or turns).
Smooth changes show volatility building or easing.
Labels:"High Vol" (deep blue, from below bar): Start of wild phase.
"Low Vol" (cyan, from above bar): Start of calm phase.
Only shows at changes to avoid clutter. Use for timing strategy tweaks.
Trading Ideas:Mood-Based Plays: In wild phases (deep blue), try chase-momentum or breakout trades since swings are bigger. In calm phases (cyan), stick to bounce-back or range trades.
Risk Tips: Cut trade sizes in wild times to handle bigger losses. Use calm times for longer holds with close stops.
Chart Time Tips: Turn on yearly scaling for matching short and long views. Test settings on past data—loosen for quick trades (more alerts), tighten for longer ones (fewer, stronger).
Mix with Others: Add trend lines or averages—buy in calm up-moves, sell in wild down-moves. Check with volume or key levels too.
Special Cases: In big news events, it reacts faster. On slow assets, it might overstate swings—ease the adjustment strength.
Limits and TipsIt looks back at past data, so it trails real-time action and can't predict ahead.
Results differ by stock or timeframe—test on history first.
Colors and tags are just visuals; set your own alerts if needed.
Follows TradingView rules: No win promises, for learning only. Open for sharing; share thoughts in forums.
With this, you can spot market energy and tweak your trades smarter. Start on practice charts.

Stochastic %K Colored by VolumeDescription:
"Stochastic %K Colored by Volume is a technical indicator that combines the traditional Stochastic %K oscillator with volume-based coloring. It highlights periods of high, low, and neutral trading volume by changing the color of the %K line. Additionally, it identifies bullish and bearish divergences between price and the %K oscillator, helping traders spot potential reversals and trend changes. The indicator also includes key levels for overbought, oversold, and extreme zones to guide trading decisions."

Dynamic 21 SMA Zone S/R (Weekly and 2-Day)This custom indicator creates a dynamic support and resistance zone based on the 21-period Simple Moving Average (SMA) from the weekly timeframe and the 21-period SMA from the 2-day timeframe. The zone is visible and functional across all chart timeframes, adapting seamlessly to provide multi-timeframe insights.
Color Logic:
Green: When the current price is fully above the upper boundary of the zone, indicating potential bullish strength or a support level.
Gray: When the price is fully below the lower boundary, signaling potential bearish pressure or a resistance level.
Light Blue: When the price is within the zone (between the two SMAs), representing a neutral "no man's land" where the market is indecisive.
As the two SMAs converge or diverge, the zone naturally thins or widens, visually reflecting changes in market momentum—such as a thinning green zone during a potential reversal. Ideal for higher-timeframe swing trading to identify key levels, this indicator is also useful on lower timeframes for gauging the relative position of these SMAs, helping traders align short-term moves with broader trends.

Orderflow Label with OffsetThis Pine Script automatically displays orderflow labels on the chart to visualize the current market structure and potential breakout or reversal zones.
It compares the current candle’s high and low with those of the previous cycle (e.g., 90 minutes) and places descriptive labels that highlight possible bullish or bearish behavior.
Functionality & Logic (Step-by-step explanation)
Inputs:
cycleLength: Defines the duration of one “cycle” in minutes (for example, 90 minutes).
labelXOffset: Moves the label a few bars to the right, so it doesn’t overlap the current candle.
labelStyleOffset: Controls whether labels appear pointing to the right or left side of the chart.
Previous Cycle:
The script uses request.security to retrieve the high and low from the previous cycle timeframe.
These act as reference points (similar to key levels or market structure highs/lows).
Current Candle:
The script reads the current bar’s high, low, and close values for comparison.
Orderflow Conditions:
bullSupport: The current high and close are both above the previous high → bullish breakout (strong continuation).
bullReject: The high breaks above the previous high but closes below → bullish rejection / possible top.
bearRes: The low and close are both below the previous low → bearish breakdown (continuation to downside).
bearReclaim: The low goes below the previous low but closes above → bearish reclaim / possible reversal.
Label Logic:
Before creating a new label, the previous one is deleted (label.delete(flowLbl)) to avoid clutter.
The label’s X position is shifted using xPos = bar_index + labelXOffset.
The style (left/right) is set based on the user’s preference.
Displayed Labels:
🟢 Bullish Breakout → price closes above the previous cycle high.
🟠 Bullish Rejection → fake breakout or possible top.
🔴 Bearish Breakdown → price closes below the previous cycle low.
🟡 Bearish Reclaim → failed breakdown or potential trend reversal.
⚪ Neutral (Wait) → no clear signal, advises patience and watching for setups (like CHoCH or FVGs).
Visual Behavior:
The labels appear slightly to the right of the bar for better visibility.
The color and text alignment dynamically adjust depending on whether the label is pointing left or right.

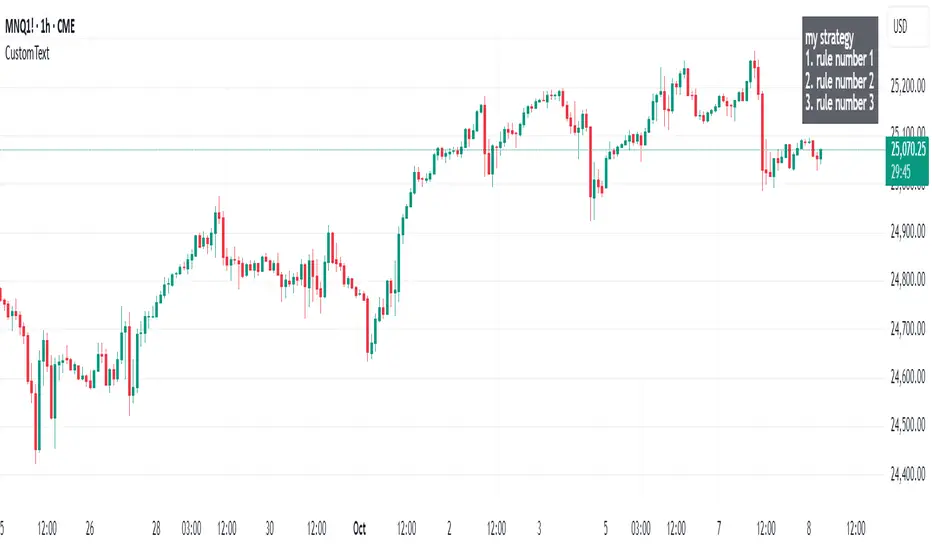
Custom Text Display📋 Custom Text Display - User Guide
Overview
This indicator allows you to display custom text anywhere on your TradingView chart with full control over appearance and positioning.
Features
📝 Text Settings
Custom Text: Write any text you want to display on your chart. Can be multiple lines.
Text Alignment: Choose how your text is aligned within the box
Left
Center
Right
Text Color: Pick any color for your text
Background Color: Choose the background color of the text box (includes transparency control)
Text Size: Select from 5 different text sizes
Tiny
Small
Normal
Large
Huge
📍 Position Settings
Table Position: Choose where the text box appears on your chart
Top Left
Top Center
Top Right
Bottom Left
Bottom Center
Bottom Right
Vertical Offset (0-20): Fine-tune the vertical position
0 = Default position (no offset)
Higher values = Move the text box further down
Use this to avoid overlapping with other indicators or chart elements
How to Use
Add the indicator to your TradingView chart
Open the settings by clicking the gear icon next to the indicator name
Enter your text in the "Custom Text" field
Customize appearance:
Choose your preferred colors for text and background
Select text size and alignment
Position the box:
Select one of the 6 main positions
Use "Vertical Offset" to fine-tune the exact position (add empty space above the text)
Click OK to apply changes
Use Cases
📊 Display trading notes or reminders
📈 Show key levels or targets
💡 Add strategy descriptions
⚠️ Display risk warnings
📝 Create custom labels for specific chart setups
🎯 Mark important price zones with descriptions
Tips
Use transparent backgrounds (adjust the transparency slider) for a cleaner look
Vertical Offset is useful when you have multiple indicators at the top/bottom and need to avoid overlap
Large/Huge text works well for important notes you want to see at a glance
Combine different text alignments with different positions for better layout control
Note: The text box updates in real-time as you change settings, so you can preview your changes before applying them.
Market Pressure Differential (MPD) [SharpStrat]Market Pressure Differential (MPD)
Concept & Purpose
The Market Pressure Differential (MPD) is a proprietary indicator designed to measure the internal balance of buying and selling pressure directly on the price chart.
Unlike standard momentum or trend indicators, MPD analyzes the structural behavior of each candle—its body, wicks, and overall range—to determine whether the market is dominated by expansion (buying aggression) or contraction (selling absorption).
This indicator provides a visual overlay of market pressure that adapts dynamically to volatility, helping traders see real-time shifts in participation intensity without using oscillators.
In simple terms:
When MPD expands upward → buyer pressure dominates.
When MPD contracts downward → seller pressure dominates.
Calculation Overview
MPD uses a structural candle formula to compute directional pressure:
Body Ratio = (Close − Open) / (High − Low)
Wick Differential = (Lower Wick − Upper Wick) / (High − Low)
Raw Pressure = (Body Ratio × Body Weight) + (Wick Differential × Wick Weight)
Then it applies:
EMA smoothing (to stabilize short-term noise)
Standard deviation normalization (to maintain consistent scaling)
ATR projection (to adapt the signal visually to volatility)
This produces the MPD projection line and the pressure ribbon, drawn directly on the main chart.
Customizable Inputs
Users can adjust color schemes, EMA smoothing length, ATR parameters, normalization length, and body/wick weighting to adapt the indicator’s sensitivity and aesthetic to different markets or chart themes.
How to Use
The Market Pressure Differential (MPD) visualizes the real-time balance between buying and selling pressure. It should be used as a contextual bias tool, not a standalone signal generator.
The white line represents the MPD projection, showing how market pressure evolves in real time based on candle structure and volatility.
The red line represents the ATR envelope, which defines the market’s expected volatility range.
MPD reacts quickly to candle structure, so trend bias is based on how its projection behaves relative to the ATR envelope:
Above the ATR band → positive pressure and bullish bias.
Below the ATR band → negative pressure and bearish bias.
Hovering near the ATR band → neutral or indecisive conditions.
The MPD percentage in the label represents the normalized strength of pressure relative to recent volatility.
Positive % = buying dominance.
Negative % = selling dominance.
Higher absolute values = stronger momentum compared to volatility.
To trade with MPD:
Watch candle colors and the projection line — green or positive % shows buyer control, red or negative % shows seller control.
Note transitions above or below the ATR level for early signs of momentum shifts.
Combine MPD signals with price structure, key levels, or volume for confirmation.
This helps reveal which side controls the market and whether that pressure is strong enough to overcome typical volatility.
Disclaimer
It introduces a novel structural–pressure approach to visualizing market dynamics.
For educational and analytical purposes only; this does not constitute financial advice.

Realtime rVOL w/ Candle Highlight [Blk0ut]About This Script
Realtime rVOL Table + Candle Highlight (Presets, No Smoothing)
By Blk0ut
This tool visualizes real-time relative volume (rVOL) directly on your chart and in a compact table, helping traders identify where intraday participation deviates from the session’s baseline.
Unlike standard volume overlays, this script recalculates rVOL dynamically through the session and highlights candles when participation exceeds configurable thresholds — providing a clear picture of ignition zones, volume surges, and potential breakout conditions.
Core Features
-Realtime rVOL tracking: Displays the current bar’s relative volume ratio compared to a moving baseline of recent bars.
-Preset Profiles: Choose from four purpose-built profiles to quickly adjust the rVOL sensitivity to your trading horizon.
----------------------------------------------------------------------
*Opening Rush: 100-bar lookback, threshold 2.5*
*RTH 5m: 30-bar lookback, threshold 1.2*
*RTH 1hr: 50-bar lookback, threshold 1.5*
*RTH 1d+: 100-bar lookback, threshold 1.5*
----------------------------------------------------------------------
RTH-only filter: Option to limit the moving average baseline to regular market hours (09:30–16:00).
Candle highlighting: Optionally outlines candles when rVOL exceeds the active threshold to emphasize spikes visually in real time.
Table display: Compact dashboard showing current rVOL, raw volume, average baseline, and preset parameters.
How To Use
Select a preset that matches your timeframe or trading style.
Scalpers and open traders can use RTH 5m or Opening Rush.
Position or swing traders may prefer RTH 1hr or RTH 1d+.
Watch for rVOL readings above the threshold (and colored candle outlines). These often correspond to momentum ignition, news impact, or institutional activity.
Combine with VWAP, ORB, or intraday key levels for best confirmation.
Notes
The table automatically adapts to your chart corner choice.
Highlight thresholds can follow the preset or be set manually.
Color intensity tiers (High/Medium/Low) can be tuned in settings.
Designed for intraday and session-based traders who rely on live volume context rather than end-of-day stats.

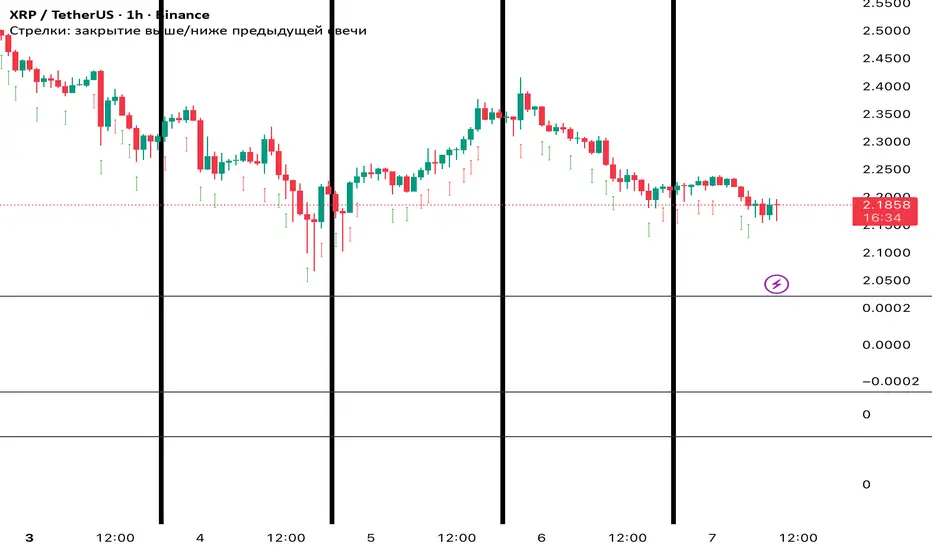
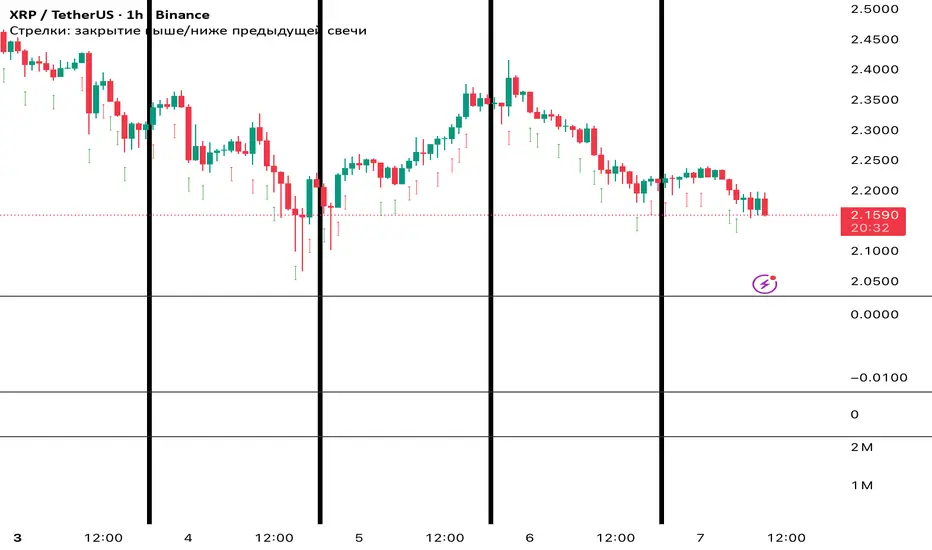
NS ND - EVR - Daily Bias - TRFxVolume & Price Action Signals
What It Does
Combines three proven trading methodologies: Effort vs Result (EVR), No Supply/No Demand (NS/ND), and Daily Bias tracking for intraday traders.
Features
Effort vs Result (EVR)
- **Bullish**: Green triangle below bar when price sweeps previous low with high volume and significant wick
- **Bearish**: Red triangle above bar when price sweeps previous high with high volume and significant wick
- Identifies potential reversals where volume doesn't match price movement
No Supply / No Demand (NS/ND)
- **No Demand (Red dot)**: Up-candle with declining volume - buyers weakening
- **No Supply (Green dot)**: Down-candle with declining volume - sellers weakening
- Grey dots = unconfirmed, colored dots = confirmed within lookahead period
- Based on Volume Spread Analysis (VSA) principles
Daily Bias Label
Top-right corner shows market direction:
- **BULLISH ↑** - Closed above Previous Day High
- **BEARISH ↓** - Closed below Previous Day Low
- **BULLISH/BEARISH REV** - Swept level but closed back inside
- **RANGE ↔** - Trading between PDH/PDL
## Settings
- **EVR**: Toggle on/off, volume multiplier, wick %, inside bars, transparency
- **NS/ND**: Toggle on/off, lookahead bars (default: 10)
- **Daily Bias**: Toggle label display
## Best For
✓ Intraday trading (1m-1h timeframes)
✓ Reversal setups
✓ Volume analysis
✓ Confluence trading (all signals align)
How to Use
1. Enable components you want (all can be toggled independently)
2. Trade EVR signals in direction of Daily Bias
3. Look for NS/ND confirmation at key levels
4. Wait for colored dots (confirmed signals) over grey (unconfirmed)
**Note**: Works on intraday timeframes only. NS/ND signals may repaint during confirmation period.

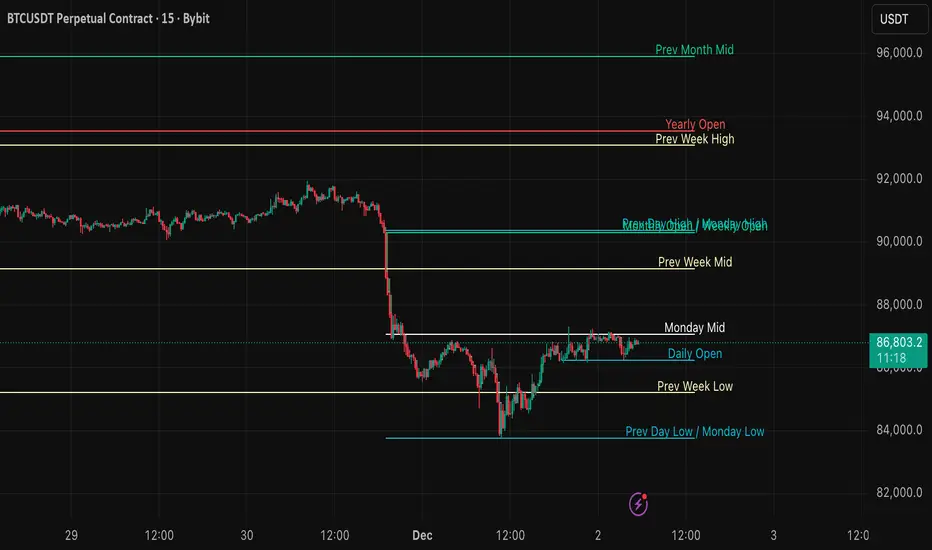
All Key Levels CompleteHave lines created for Yesterday Close, Prior Day High, Prior Day -1 Close, Prior Day Low, Prior Day -1 Low, Premarket High and Premarket Low.

OR Box + Full Key Levels (Cash Hours • Strict v5)This is the final working script, just choose from the drop down to adjkust for Europeon / US markets

Volume Pressure Arrows[Blk0ut]Volume Pressure Arrows are an innovative (I think) market pressure tool designed to cut through noise and provide traders with a realistic, but quick insight into buying vs selling pressure and which has real control. Rather than relying on any single classic indicator, this script blends five complementary measures of price–volume dynamics—Cumulative Volume Delta (CVD), VWAP distance, OBV slope, ATR expansion, and the DMI ratio—into a unified “pressure score.”
Each component is normalized, weighted, and combined into a single metric that can be read at a glance through intuitive up and down arrows plotted directly on the chart. By transforming multiple complex data streams into a single aggregated signal, Volume Pressure Arrows help traders answer some of the hardest questions we can face: is the current move backed by conviction? is there true momentum? Is price action about to reverse?
Why It’s Different
Traditional oscillators often create conflicting signals, forcing traders to guess which one to trust. This indicator integrates five perspectives on volume and momentum pressure into a single framework, balancing raw flow (CVD), relative positioning (VWAP), trend conviction (OBV slope), volatility expansion (ATR), and directional bias (DMI). The result is a weighted, probability-minded score capped between -100 and +100 for consistency and clarity.
Important note : Inspiration for the use of directly plotted arrows came from dgtrd "https://www.tradingview.com/u/dgtrd/" and their brilliant work on LazyBear's Squeeze Indicator "https://www.tradingview.com/script/Dsr7B2xE-Squeeze-Momentum-Indicator-LazyBear-vX-by-DGT/"
How to Read It
Bullish Arrows appear below the candles when the pressure score pushes above the neutral threshold, signaling meaningful buyer dominance.
Bearish Arrows appear above the candles when pressure drops below the negative threshold, indicating strong selling pressure.
Neutral Arrows (smaller, faded) mark conditions where pressure exists but is not decisive—useful for spotting early rotations or fading momentum.
Color Gradients dynamically adjust with score intensity, making stronger signals visually brighter and weaker ones softer.
How to Use It Effectively
This tool is best applied as a confirmation and timing layer. It is not meant to replace your core strategy, but to validate whether momentum pressure supports your trade thesis.
Combine with trendlines, chart patterns, or breakouts to gauge conviction.
Use bullish or bearish arrows as filters, only take trades when price action aligns with strong directional pressure.
Watch neutral arrows near key levels; they often foreshadow balance breaking into directional moves.
Adjust the weightings to emphasize the components that matter most to your style (e.g., more weight on CVD for scalpers, or ATR expansion for volatility traders).
As with any indicator, this is not a magic ball and does not guarantee success. But it does allow you to increase the probability odds to your favor if you align it with your edge. Happy trading!

Liquidity Void Detector (Zeiierman)█ Overview
Liquidity Void Detector (Zeiierman) is an oscillator highlighting inefficient price displacements under low participation. It measures the most recent price move (standardized return) and amplifies it only when volume is below its own trend.
Positive readings ⇒ strong up-move on low volume → potential Buy-Side Imbalance (void below) that often refills.
Negative readings ⇒ strong down-move on low volume → potential Sell-Side Imbalance (void above) that often refills.
This tool provides a quantitative “void” proxy: when price travels far with unusually thin volume, the move is flagged as likely inefficient and prone to mean-reversion/mitigation.
█ How It Works
⚪ Volume Shock (Participation Filter)
Each bar, volume is compared to a rolling baseline. This is then z-scored.
// Volume Shock calculation
volTrend = ta.sma(volume, L)
vs = (volume > 0 and volTrend > 0) ? math.log(volume) - math.log(volTrend) : na
vsZ = zScore(vs, vzLen) // z-scored volume shock
lowVS = (vsZ <= vzThr) // low-volume condition
Bars with VolShock Z ≤ threshold are treated as low-volume (thin).
⚪ Prior Return Extremeness
The 1-bar log return is computed and z-scored.
// Prior return extremeness
r1 = math.log(close / close )
retZ = zScore(r1, rLen) // z-scored prior return
This shows whether the latest move is unusually large relative to recent history.
⚪ Void Oscillator
The oscillator is:
// Oscillator construction
weight = lowVS ? 1.0 : fadeNoLow
osc = retZ * weight
where Weight = 1 when volume is low, otherwise fades toward a user-set factor (0–1).
Osc > 0: up-move emphasized under low volume ⇒ Buy-Side Imbalance.
Osc < 0: down-move emphasized under low volume ⇒ Sell-Side Imbalance.
█ Why Use It
⚪ Targets Inefficient Moves
By filtering for low participation, the oscillator focuses on moves most likely driven by thin books/noise trading, which are statistically more likely to retrace.
⚪ Simple, Robust Logic
No need for tick data or order-book depth. It derives a practical void proxy from OHLCV, making it portable across assets and timeframes.
⚪ Complements Price-Action Tools
Use alongside FVG/imbalance zones, key levels, and volume profile to prioritize voids that carry the highest reversal probability.
█ How to Use
Sell-Side Imbalance = aggressive sell move (price goes down on low volume) → expect price to move up to fill it.
Buy-Side Imbalance = aggressive buy move (price goes up on low volume) → expect price to move down to fill it.
█ Settings
Volume Baseline Length — Bars for the volume trend used in VolShock. Larger = smoother baseline, fewer low-volume flags.
Vol Shock Z-Score Lookback — Bars to standardize VolShock; larger = smoother, fewer extremes.
Low-Volume Threshold (VolShock Z ≤) — Defines “thin participation.” Typical: −0.5 to −1.0.
Return Z-Score Lookback — Bars to standardize the 1-bar log return; larger = smoother “extremeness” measure.
Fade When Volume Not Low (0–1) — Weight applied when volume is not low. 0.00 = ignore non-low-volume bars entirely. 1.00 = treat volume condition as irrelevant (pure return extremeness).
Upper Threshold (Osc ≥) — Trigger for Sell-Side Imbalance (void below).
Lower Threshold (Osc ≤) — Trigger for Buy-Side Imbalance (void above).
-----------------
Disclaimer
The content provided in my scripts, indicators, ideas, algorithms, and systems is for educational and informational purposes only. It does not constitute financial advice, investment recommendations, or a solicitation to buy or sell any financial instruments. I will not accept liability for any loss or damage, including without limitation any loss of profit, which may arise directly or indirectly from the use of or reliance on such information.
All investments involve risk, and the past performance of a security, industry, sector, market, financial product, trading strategy, backtest, or individual's trading does not guarantee future results or returns. Investors are fully responsible for any investment decisions they make. Such decisions should be based solely on an evaluation of their financial circumstances, investment objectives, risk tolerance, and liquidity needs.
